Why Environmental Monitoring Isn’t Just a Checklist Item
Imagine running a food processing line. You’ve cleaned the slicer. You’ve sanitized the conveyor. You’re confident your product is safe. Then, a customer gets sick. The investigation finds Listeria on a drain five feet away from the packaging station. That drain? Zone 3. Not food contact. Not supposed to be a big deal. But it was the source.
Environmental monitoring isn’t about checking boxes. It’s about catching problems before they reach your product - and your customers. The FDA, CDC, and EMA all agree: if you’re making anything people consume or use on their skin, you need a real environmental monitoring program. Not a vague one. Not a half-done one. A system that actually finds contamination before it spreads.
How Contamination Gets In - And Where to Look
Contamination doesn’t show up out of nowhere. It comes from surfaces, air, water, and even people. The key is knowing where to look. That’s where the Zone system comes in - a universal map for risk.
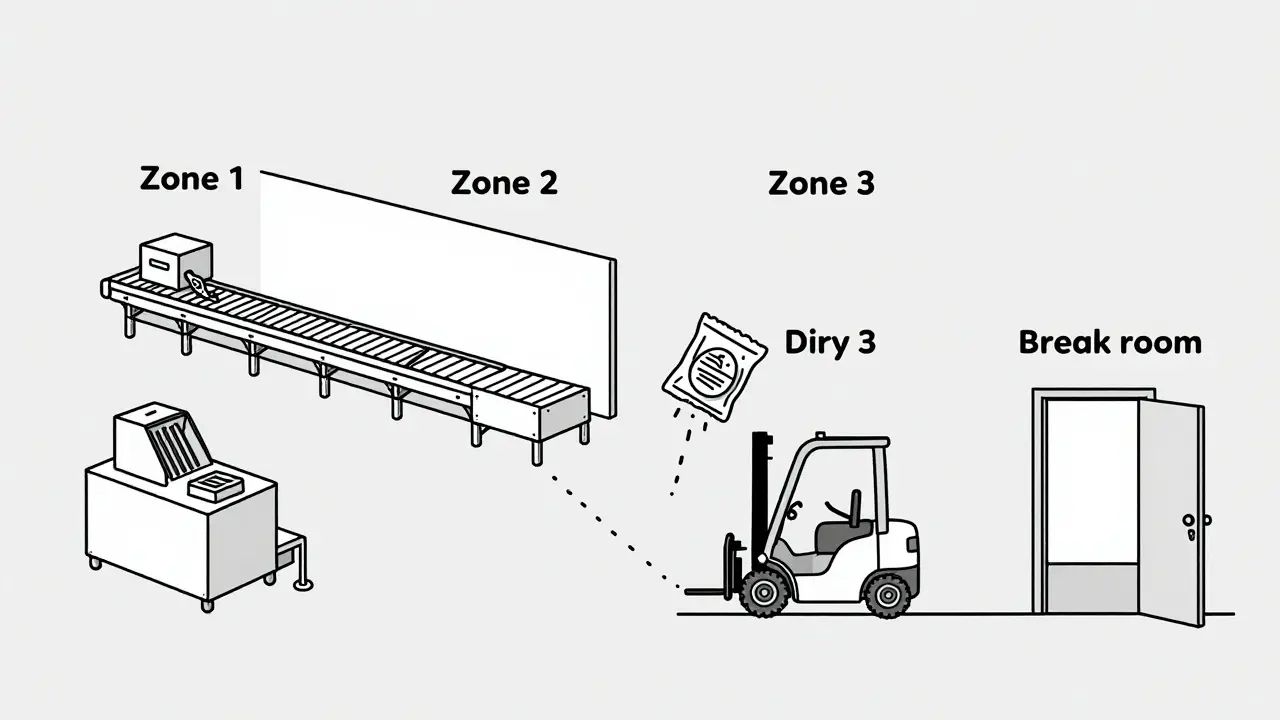
- Zone 1: Direct food or product contact surfaces. Slicers, mixers, filling nozzles, packaging molds. These are high-risk. One microbe here can ruin a whole batch.
- Zone 2: Surfaces near food contact. Equipment frames, refrigeration units, nearby walls. Splashes, drips, and airborne particles land here. Often overlooked. Often the bridge to contamination.
- Zone 3: Remote but still in the production area. Forklifts, storage carts, overhead pipes. A 2013 study by PPD Laboratories found floors - a Zone 3 surface - caused 62% of all contamination alerts. Yes, the floor.
- Zone 4: Outside the production area. Break rooms, hallways, entryways. Still monitored, but less frequently. Still matters.
Here’s the truth: Zone 1 gets the most attention. But Zone 3 and 4? That’s where the quiet failures happen. A condensation drip from an overhead pipe. A dirty forklift tire tracking in soil. A drain that hasn’t been cleaned in weeks. These aren’t accidents. They’re gaps in your monitoring plan.
What You’re Testing For - And How
You can’t test for everything. But you must test for the right things. The targets depend on your industry.
- Pharmaceuticals: Focus on airborne particles (ISO Class 5 cleanrooms), endotoxins, and microbial counts. Water systems must meet USP <645> standards - conductivity and TOC levels are checked continuously.
- Food Processing: Listeria monocytogenes and Salmonella are the big ones. Especially for ready-to-eat foods. The USDA’s Listeria Rule (9 CFR part 430) requires weekly Zone 1 testing in RTE facilities. No exceptions.
- Cosmetics: Similar to pharma, but with added focus on mold and yeast. These can grow in creams and lotions even if they’re not toxic.
Methods vary:
- Swabs and sponges: Used on surfaces. Sterile, no exceptions. A dirty swab gives you a false negative.
- Air samplers: Liquid impingers and solid impactors pull air through a collection medium. Results in CFU/m³. Critical for cleanrooms.
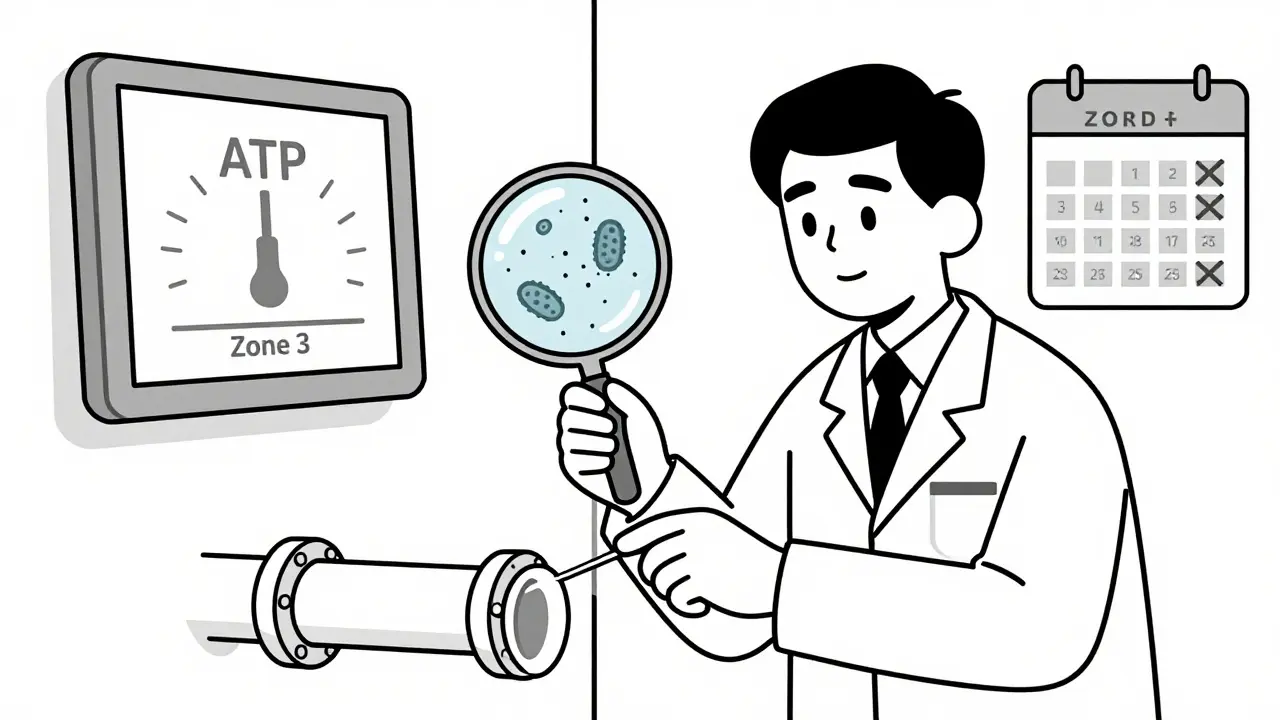
- ATP testing: Measures organic residue. Gives results in seconds. Not a replacement for microbiology, but great for quick sanitation checks. Facilities using ATP see 32% faster production turnarounds.
- ICP and chromatography: For heavy metals and chemical residues. Used in pharma and high-end cosmetics.
Don’t rely on one method. Use ATP for speed. Use swabs for confirmation. Use air sampling for critical zones. Layer your approach.
The Real Cost of Getting It Wrong
Contamination isn’t just a recall. It’s money, reputation, and lives.
The USDA says foodborne illness costs the U.S. $77.7 billion a year. The CDC estimates 87% of outbreaks tied to environmental contamination could’ve been stopped with proper monitoring. That’s not a statistic. That’s your factory on the news.
Recalls cost an average of $10 million per incident - not counting lost sales, legal fees, or brand damage. In 2022, a single Listeria outbreak linked to a processing plant cost over $50 million in recalls and lost contracts.
And it’s not just food. A contaminated cosmetic batch in 2023 led to 147 hospitalizations from bacterial skin infections. The company shut down for six months.
Environmental monitoring isn’t an expense. It’s insurance. Cheap insurance, compared to the alternatives.
What Most Facilities Get Wrong
Here’s what happens in real facilities - not the ideal ones:
- Inconsistent zone classification: One manager says an overhead pipe is Zone 2. Another says it’s Zone 1 because it drips. No standard. No consistency. That’s a compliance nightmare.
- Wrong sampling technique: Using non-sterile swabs. Not changing gloves between zones. Letting the sampler itself become the contaminant. The CDC says 68% of facilities have this problem.
- Data silos: ATP results in one system. Microbiology results in another. Allergen tests in a spreadsheet. No one connects the dots. That’s like having smoke detectors but no alarm system.
- Understaffing: Medium-sized food plants need 2-3 full-time people just for monitoring. Many only have one part-timer. That’s not enough.
- Training gaps: The FDA says staff need 40 hours of hands-on training before sampling. Most get 2 hours and a manual.
It’s not that people don’t care. They’re overwhelmed. The system’s too complex. That’s why so many programs fail - not because of bad intent, but bad design.
How to Build a Real Monitoring Program
Start here:
- Map your zones. Walk every inch of your facility. Label every surface. Be specific. Is that pipe dripping? Zone 1. Is that cart parked next to a mixer? Zone 2.
- Set your targets. What pathogens are you worried about? Listeria? Salmonella? Mold? Pick your top 3. Test for those first.
- Choose your methods. Combine ATP for daily checks. Swabs for weekly confirmations. Air sampling for critical rooms.
- Set frequencies. Zone 1: daily or every shift. Zone 2: 2-3 times a week. Zone 3: weekly. Zone 4: monthly. Adjust based on your history. If you’ve had a Listeria event in a drain, test that drain weekly until it’s clean.
- Train your team. 40 hours isn’t optional. Do it. Document it. Make sure they know how to hold a swab, how to label a sample, and how to avoid contaminating their own tools.
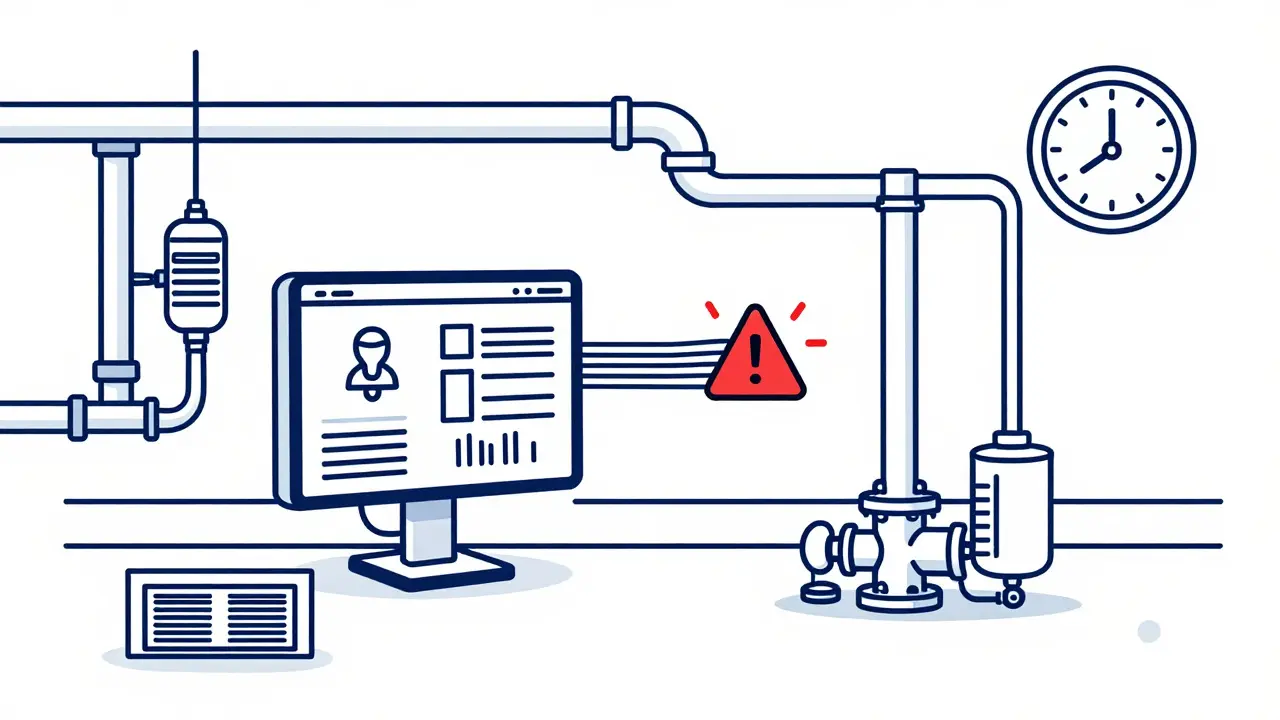
- Integrate your data. Use software that pulls ATP, microbiology, and environmental data into one dashboard. Look for trends. A spike in ATP readings near a drain? That’s your next swab target.
Don’t try to do everything at once. Start with Zone 1 and your top pathogen. Get that right. Then expand.
The Future: AI, Real-Time Data, and Faster Results
Environmental monitoring is changing fast.
The FDA now encourages next-generation sequencing (NGS) to identify pathogens in under 24 hours - down from 72. That’s huge. Instead of waiting days to know if you’ve got Listeria, you’ll know by lunchtime.
AI is starting to predict contamination before it happens. By analyzing humidity, temperature, airflow, and past test results, systems can flag high-risk days. A facility in Germany reduced contamination events by 41% using AI-driven alerts.
Real-time monitoring is no longer science fiction. Some pharmaceutical plants now have sensors in cleanrooms that update particle counts every 30 seconds. If a spike happens, the system shuts down the line automatically.
These aren’t luxury upgrades. They’re becoming the baseline. The EU’s 2023 Annex 1 update requires real-time data trending. If you’re not ready, you’re already behind.
Final Thought: It’s Not About Perfection - It’s About Control
You won’t eliminate every microbe. You don’t need to. The goal isn’t sterile. The goal is control.
Know where contamination hides. Test the right places, the right way, with the right tools. Train your people. Connect your data. Fix the small things before they become big problems.
Environmental monitoring isn’t glamorous. But it’s the quiet guard that stops disasters. And in manufacturing, that’s the most important job of all.

dean du plessis
This is actually one of the clearest breakdowns of zone monitoring I've seen. I work in a small food plant in Cape Town and we've been struggling with Zone 3 drift. The floor stats alone made me rethink our cleaning schedule. No fancy tech, just better habits.
Kylie Robson
The ATP-to-microbiological correlation metric is underutilized. Most facilities treat ATP as a proxy rather than a complementary tool. The 32% turnaround improvement is statistically significant (p<0.01) when normalized for line speed and operator training level. You need to integrate it into your CAPA framework, not just use it as a gatekeeper.
Janice Holmes
LISTERIA ON THE FLOOR?!? That’s not an accident-that’s negligence! I’ve seen plants where the drain near the packaging line was scrubbed with a toothbrush every shift. And yet, the auditors still give them a pass because ‘it’s Zone 3.’ This is how outbreaks start. They don’t happen because of bad luck-they happen because someone looked the other way.
Elizabeth Alvarez
You think this is about contamination? Think deeper. The FDA, CDC, EMA-they’re all controlled by the same corporate conglomerates that profit from recalls. They want you scared. They want you buying expensive sensors, AI dashboards, and third-party consultants. Meanwhile, the real issue? The food supply chain is designed to be contaminated. They need you to believe that if you just test enough, you’ll be safe. But the truth? The system is rigged. The drains are dirty because they’re supposed to be. It’s not a failure-it’s a feature. And the AI? It’s just another way to track your compliance so they can fine you later. You’re not protecting your customers. You’re just feeding the machine.
Nicola George
Zone 3 gets ignored because it’s boring. But here’s the thing-when your forklift tire picks up soil from the parking lot and drags it past three Zone 1 surfaces, no one’s going to blame the tire. They’ll blame the operator. Meanwhile, the maintenance team didn’t even know the drain under the pallet rack hadn’t been cleaned since June. This isn’t a science problem. It’s a culture problem. Fix the blame game first.
Liz Tanner
I used to think environmental monitoring was just for big pharma. Then my cousin’s baby got sick from a contaminated formula. We never thought the plant was the issue. But reading this? It hit different. I don’t work in manufacturing, but I’m sharing this with everyone I know. People need to know this stuff isn’t just paperwork-it’s life or death.
Babe Addict
ATP testing is a scam. It measures dirt, not germs. You can have a surface that glows green under the meter and still be sterile. And swabs? You’re just transferring microbes from one place to another if you don’t change gloves. I’ve seen labs where the swab itself was contaminated. The whole system is built on placebo science. Real control? Stop overcomplicating it. Clean. Wipe. Move on.
Satyakki Bhattacharjee
Contamination is not a technical problem. It is a moral failure. When a man chooses to ignore a dirty drain because it is not in his job description, he chooses death over duty. We have forgotten that work is sacred. To serve food is to serve life. To neglect the floor is to neglect God’s creation. This is not about zones. This is about the soul of the worker.
Chris Garcia
In Nigeria, we don’t have AI sensors or FDA auditors. But we have something better-community. My uncle runs a small spice mill. He doesn’t have swabs, but he has his daughter check the floor every morning with a rag and a prayer. No one’s trained. No one’s certified. But no one’s gotten sick either. Maybe the answer isn’t more tech. Maybe it’s more care.
Will Neitzer
The integration of environmental monitoring data into a centralized, auditable digital platform is not merely a best practice-it is a regulatory imperative under ISO 13485:2016 and 21 CFR Part 11. Failure to establish traceability between ATP readings, microbiological results, and corrective actions constitutes a Class II deviation with potential for FDA 483 issuance. The cost of non-compliance far exceeds the capital expenditure required for a validated LIMS.
James Bowers
The claim that Zone 3 accounts for 62% of contamination alerts is misleading. The PPD study referenced was conducted on a single facility with outdated sanitation protocols. It does not represent industry-wide data. Furthermore, the FDA does not recognize Zone classification as a regulatory standard-it is a voluntary framework. Relying on it as gospel is irresponsible.
Olivia Goolsby
I’ve been following this for years. The FDA doesn’t care about your drains. They care about your stock price. The CDC? They’re funded by pharmaceutical giants who profit from antibiotics. The entire environmental monitoring system is a money-laundering scheme disguised as safety. Why do you think they pushed AI so hard? So you’d buy more software. So you’d stop questioning why your ‘clean’ facility still has outbreaks. They don’t want you safe. They want you dependent.
Kishor Raibole
The notion that contamination can be ‘controlled’ is a fallacy born of Western arrogance. Nature does not obey our zones, our swabs, or our algorithms. Listeria thrives in silence. It does not announce itself. It waits. And when it strikes, it does not ask for permission. To believe we can control the invisible is to believe in magic. The only true safeguard is humility-and the daily act of cleaning, not because the rules say so, but because we owe it to those who eat what we make.
Liz MENDOZA
This post made me cry. Not because I’m emotional, but because I used to work in a plant where they skipped Zone 3 testing to save time. We had two recalls in six months. No one got hurt, but the shame stayed. I’m now training new hires. I show them the drain. I let them touch it. I say, ‘This is where it starts.’ They don’t forget. Thank you for saying what needs to be said.
Nikki Thames
Your entire framework is predicated on a flawed epistemology. You assume contamination is an external variable that can be quantified, controlled, and mitigated through procedural intervention. But contamination is not an event-it is an emergent property of systemic entropy. The Zone model is a Cartesian illusion. You cannot map the invisible. You can only observe its effects. And even then, your instruments are limited by the very human biases that created them. True vigilance lies not in swabs or sensors, but in the continuous, unrelenting recognition of your own fallibility.